
The English Indices of Deprivation 2019 provide a set of relative measures of deprivation for small areas (LSOAs: Lower-layer Super Output Areas) across England, based on seven domains of deprivation. These domains are combined to produce the overall Index of Multiple Deprivation (IMD). The seven domains are weighted as follows:
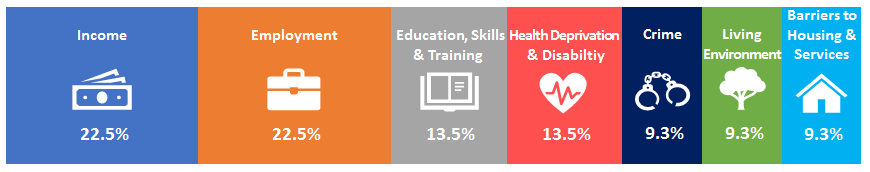
Several indicators are used within each domain, they are listed in full in the Statistical Release.
The Indices of Deprivation also include two supplementary indices – the Income Deprivation Affecting Children Index (IDACI) and the Income Deprivation Affecting Older People Index (IDAOPI).
Collectively, these scores allow users to compare LSOAs and Local Authorities (LAs) in England to identify the most deprived areas and provide a guide to help organisations allocate resources.
The Indices are relative measures and do not allow us to determine absolute deprivation – they do not quantify precisely how deprived or affluent an area, household or individual is. It is also worth noting that the underlying data is of variable currency (2011-2019).
Local measures of deprivation across England have been published periodically since the 1970s, however the indicators, methodology and geographies used have frequently changed. The constant approach used between 2015 and 2019 allows us to compare changes in relative deprivation. This page will summarise key overall findings and changes in relative deprivation for Wandsworth at the following levels:
Below, you will also find an infographic which visually summarises the findings and dashboards that have been developed to allow users to interact with the data.
For optimal viewing, please see the Wandsworth Borough Indices of Deprivation 2019 Story Map.
Infographic
Borough Level Findings
- Wandsworth is within the 50% least deprived Local Authorities (LAs) in England, where in 2015, it was amongst the 50% most deprived.
- Wandsworth ranks amongst the least deprived LAs in England for four of seven deprivation domains (Income; Employment; Education, Skills & Training and Health Deprivation & Disability) – it has a particularly high ranking for Education, Skills & Training and compared to 2015, its rank and score for Income have improved (Figure 1).
- Despite relatively less deprived rankings since 2015, Wandsworth’s most deprived measures were the Living Environment and Income Deprivation Affecting Older People (IDAOPI) measure both regionally and nationally.
- In line with many other London boroughs, Wandsworth ranks amongst the more deprived LAs in England for the Barriers to Housing & Services and Crime domains.
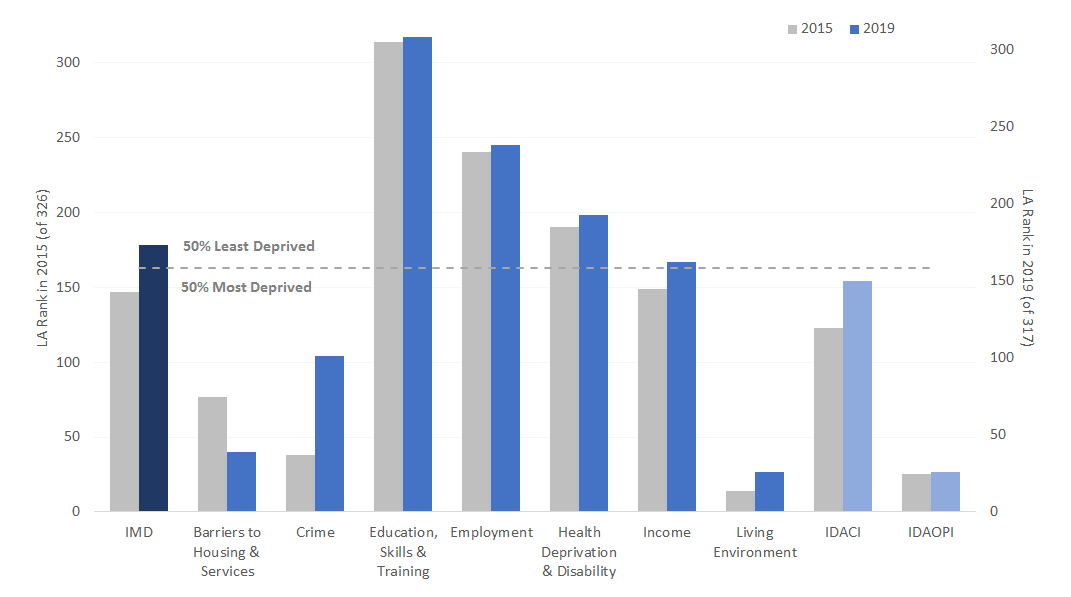 Figure 1. Wandsworth rank against other local authorities in England for IMD, deprivation domains and supplementary measures (2015 and 2019). Dashed line indicates where borough falls within 50% most or 50% least deprived local authorities.
- Wandsworth remains within the least deprived third of London LAs, between 2015 and 2019.
- Wandsworth ranks amongst the least deprived LAs in London for five of seven deprivation domains (Income; Employment; Education, Skills & Training; Barriers to Housing & Services and Crime) (Figure 2).
- Between 2015 and 2019, Wandsworth moved from the 50% least deprived to the 50% most deprived London boroughs in the Health Deprivation & Disability domain.
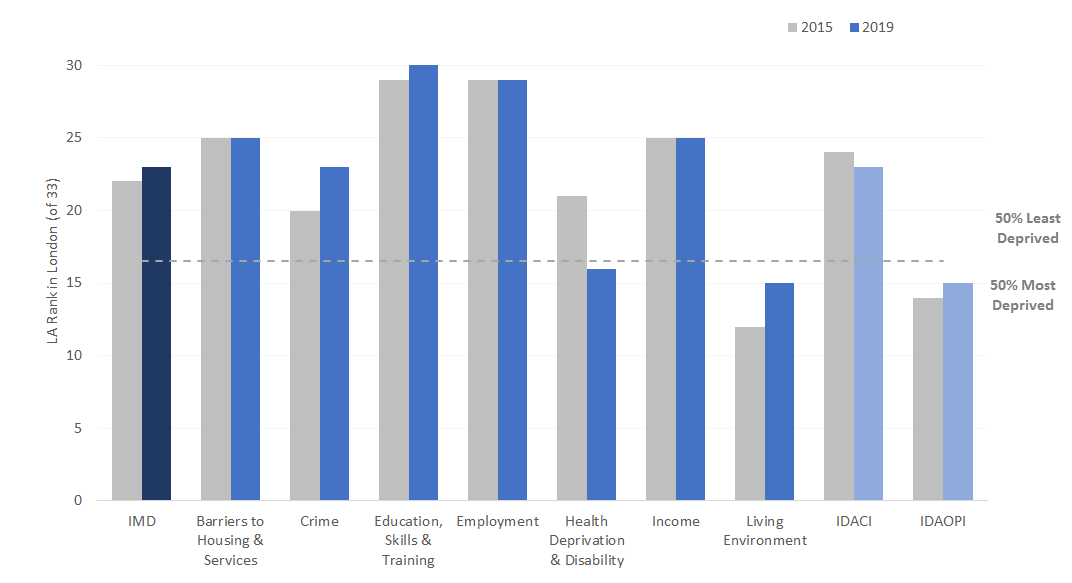
Figure 2 Wandsworth rank against other local authorities in London for IMD, deprivation domains and supplementary measures (2015 and 2019). Dashed line indicates where borough falls within 50% most or 50% least deprived local authorities.
Borough Dashboard
LSOA Level Findings
- In contrast to 2015, no Wandsworth LSOAs were ranked amongst the 10% most deprived in England on the Index of Multiple Deprivation (IMD). There were clusters of more deprived LSOAs within the easterly, westerly and southerly points of the borough (Figure 3).
- There was a general reduction in the number of LSOAs ranked across the 50% most deprived deciles and a corresponding increase amongst the least deprived (see Figure 4 for IMD decile changes).
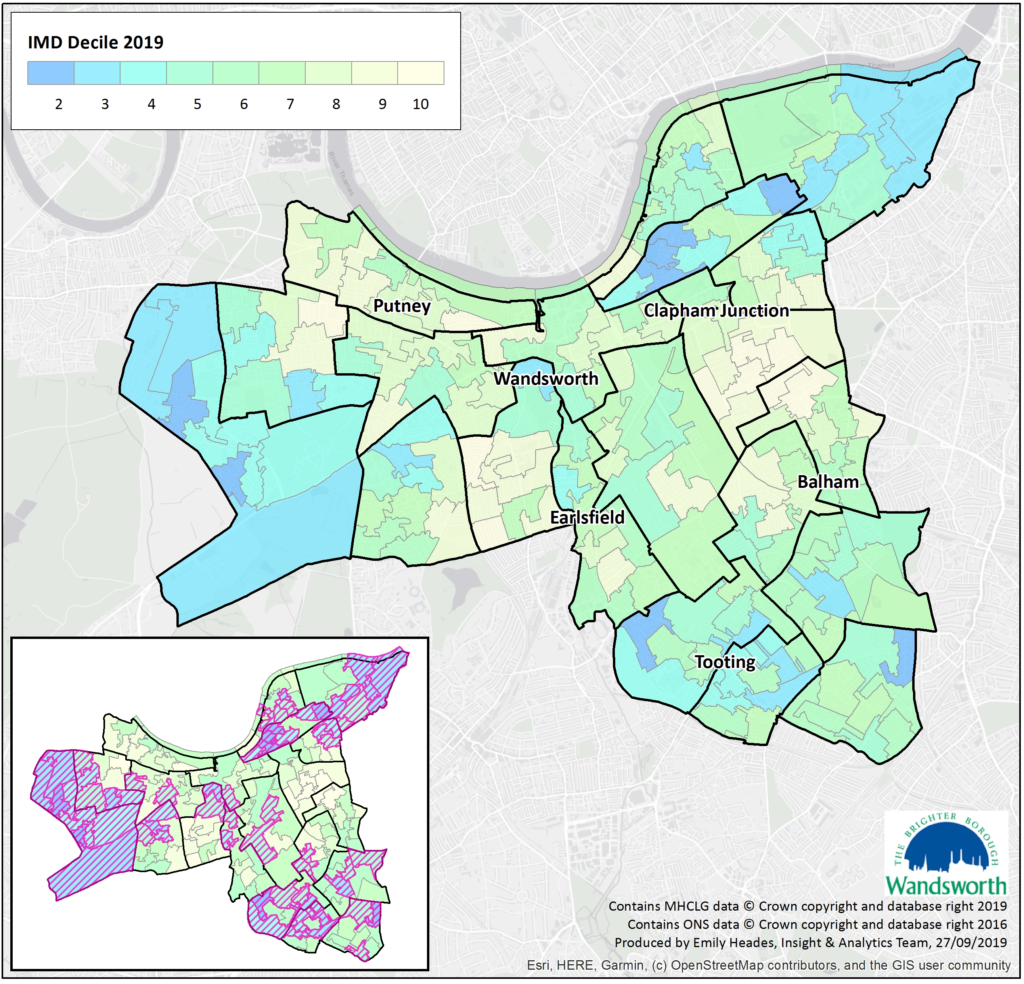
Figure 3 LSOAs mapped by IMD decile – blue shades are more deprived and yellow shades are less deprived. The hatched areas in the inset depict LSOAs amongst the 50% most deprived in England (deciles 1-5).
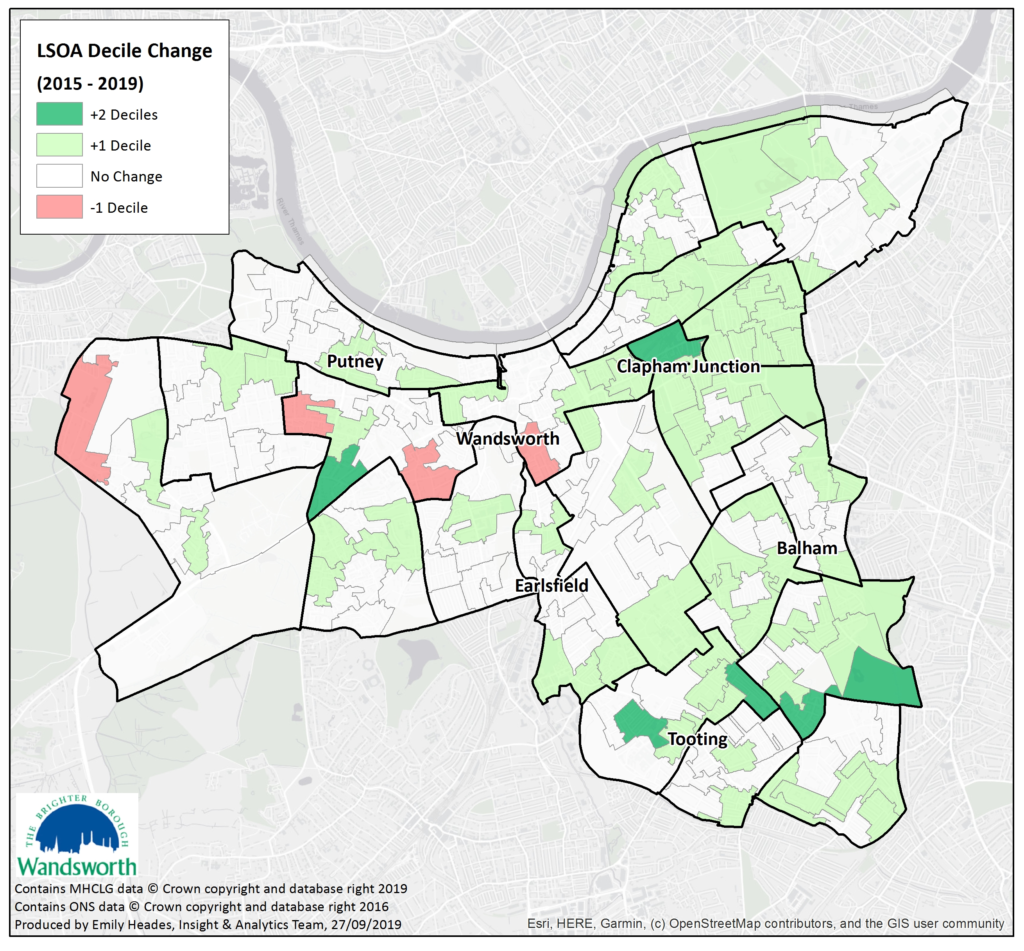
Figure 4 LSOAs mapped by change in IMD decile between 2015 and 2019 – Red areas are relatively more deprived and green areas are relatively less deprived.
- 38% of Wandsworth residents live within the 50% most deprived LSOAs nationally, down from 47% in 2015 and a smaller proportion than London where over 60% of the population live in the 50% most deprived LSOAs in England (ONS mid-2017 small area population estimates).
- Within the Living Environment domain, 97% of Wandsworth residents live in the 50% most deprived LSOAs nationally compared to 85% of the London population.
- Wandsworth had three LSOAs that ranked amongst the 10% most deprived in London (down from four LSOAs in 2015) – collectively home to 5,300 residents.
- Within London (regionally), almost 50% of LSOAs in Wandsworth were ranked as relatively more deprived (moved down deprivation deciles) in the Health Deprivation & Disability domain. Now, almost 50% of LSOAs in the borough fall amongst the 50% most deprived LSOAs in London compared to 35% in 2015 – this explains the borough level shift.
LSOA Dashboard
Ward Level Findings
- The three LSOAs amongst the 10% most deprived in London were in Latchmere (2) and Tooting (1).
- Balham, Northcote and Thamesfield had no LSOAs amongst the 50% most deprived nationally and regionally on the Index of Multiple Deprivation (IMD). Locally, Thamesfield and Northcote had the fewest LSOAs amongst the 50% most deprived.
- All LSOAs in Roehampton and 88% of LSOAs in Latchmere are within the 50% most deprived nationally, regionally and locally on the IMD.
- Locally, Graveney, Queenstown and Tooting also have large proportion of LSOAs amongst the borough’s 50% most deprived.
- Regionally and locally, Roehampton has the most deprived LSOAs across all indices apart from IDAOPI (where Bedford and Graveney have an equal number of deprived LSOAs), Crime and Living Environment (where it is one of the least deprived wards).
- At the regional level, Queenstown had the most LSOAs ranked as relatively more deprived (moving down deprivation deciles) (40%) between 2015 and 2019 where locally, Thamesfield saw the most relative change in this direction (67%).
- Both regionally and locally, Balham and Southfields had the most LSOAs moving down into a more deprived decile in the Health Deprivation & Disability domain.
- Locally, regionally and nationally, Shafetsbury has most LSOAs moving up into a less deprived decile.
Ward Dashboard
Other resources related to the Indices of Deprivation can be found on our Links & Resources page.